
Health metrics
This page defines the health metrics shown on the Enterprise dashboard, site dashboards, Field App, and device-detail views.
Signal quality: dual-margin rating
Section titled “Signal quality: dual-margin rating”Signal quality is evaluated using two complementary margins. The device’s rating is the worse of the two, which is more conservative and operationally useful than raw RSSI alone.
- SNR margin = measured SNR − required SNR for the device’s spreading factor (headroom above the decode floor).
- ESP margin = estimated received signal power − receiver sensitivity for the device’s spreading factor.
Diagnostic messaging distinguishes noise/interference-limited links from weak/range-limited links. A reported SNR of 0.0 is treated as missing; when spreading factor is unavailable, SF9 is assumed.
| Rating | Margin |
|---|---|
| Strong | ≥ 15 dB |
| Good | 10 to < 15 dB |
| Fair | 5 to < 10 dB |
| Poor | < 5 dB |
Signal Health tooltip
Section titled “Signal Health tooltip”On the Site Health dashboard, hover over a problem device row — any device flagged with poor or fair signal — to open a Signal Health tooltip with the full diagnostic breakdown for that link. It shows each margin and its rating, which one is currently governing (the worse of the two, and therefore the rating the device receives), packet loss over the last 24 hours, uplinks received and dropped, the raw RSSI / SNR / SF, and a plain-language explanation of what’s limiting the link and what to check.
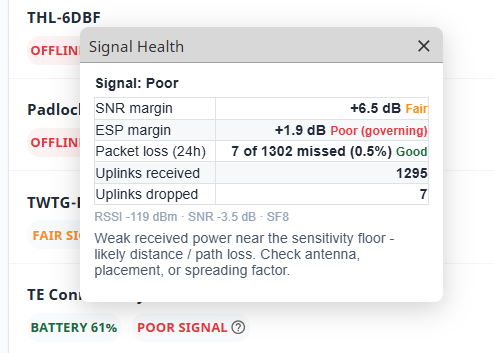
In the example above, the SNR margin is Fair but the ESP margin is Poor, so ESP is governing and the device is rated Poor. The note — weak received power near the sensitivity floor — points to distance or path loss, so the fix is antenna, placement, or spreading factor rather than noise or interference.
Battery health
Section titled “Battery health”Battery is shown as one reading per device; SiteSync auto-detects whether the tag is in volts or percent. Missing battery data is Unknown and is not counted as healthy.
| Tier | Voltage | Percent |
|---|---|---|
| Good | ≥ 3.5 V | ≥ 30% |
| Low (warning) | 3.3 – 3.5 V | 15 – 30% |
| Critical | < 3.3 V | < 15% |
Packet delivery (24-hour)
Section titled “Packet delivery (24-hour)”When tag history is unavailable, packet loss is inferred from gaps in the uplink frame counter (fCntUp), which increments by 1 per uplink, over a rolling 24-hour window. Device diagnostics show missed and received uplink counts for the current window (for example, “x of y uplinks missed in last 24h”).
Device status
Section titled “Device status”Device statuses are mutually exclusive and reconcile to the total device count:
- Online
- Never Activated
- Missed Check-in (formerly “Offline”)
- Decode Error
- Other
Battery and signal are orthogonal flags layered on top — a device can be Online and still flagged.
Needs Attention
Section titled “Needs Attention”Needs Attention counts distinct devices that are Missed Check-in, at Critical battery, or at Fair/Poor signal.
Site Health Score (0–100)
Section titled “Site Health Score (0–100)”A quick overall indicator of a site’s health:
Site Health Score = 50% uptime + 30% battery health + 20% signal quality- Uptime (50%) = online devices ÷ activated devices × 100. Never-activated devices are excluded.
- Battery (30%) = built from Good/Warning counts among devices with a battery reading; devices with no reading are excluded.
- Signal (20%) = the average per-device signal strength, over devices where RSSI/SNR/SF exist.
Components without reported data are excluded from the score.